We hold quarterly hackathons at JUST EAT tech, and for the last hackathon of 2015 my team (Ahmed Malik and Raffi Tamizian) and I decided to take a leaf out of Adam Tornhill’s book to see if we could gain some insights into the way we work by analysing our commit histories. At the same time, we wanted to combine other analysis to get a better understanding of the quality of our codebase and how they have changed over time.
Oh, and it was also a chance for us to flex our F# muscles.
Getting started
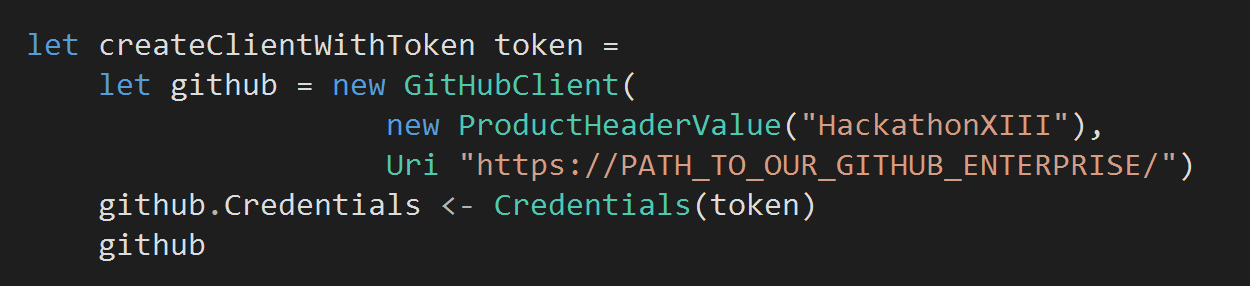
First, we need to be able to talk to Github easily and thankfully Octokit makes this relatively painless. So let’s go ahead and create a function to instantiate a new GitHubClient…
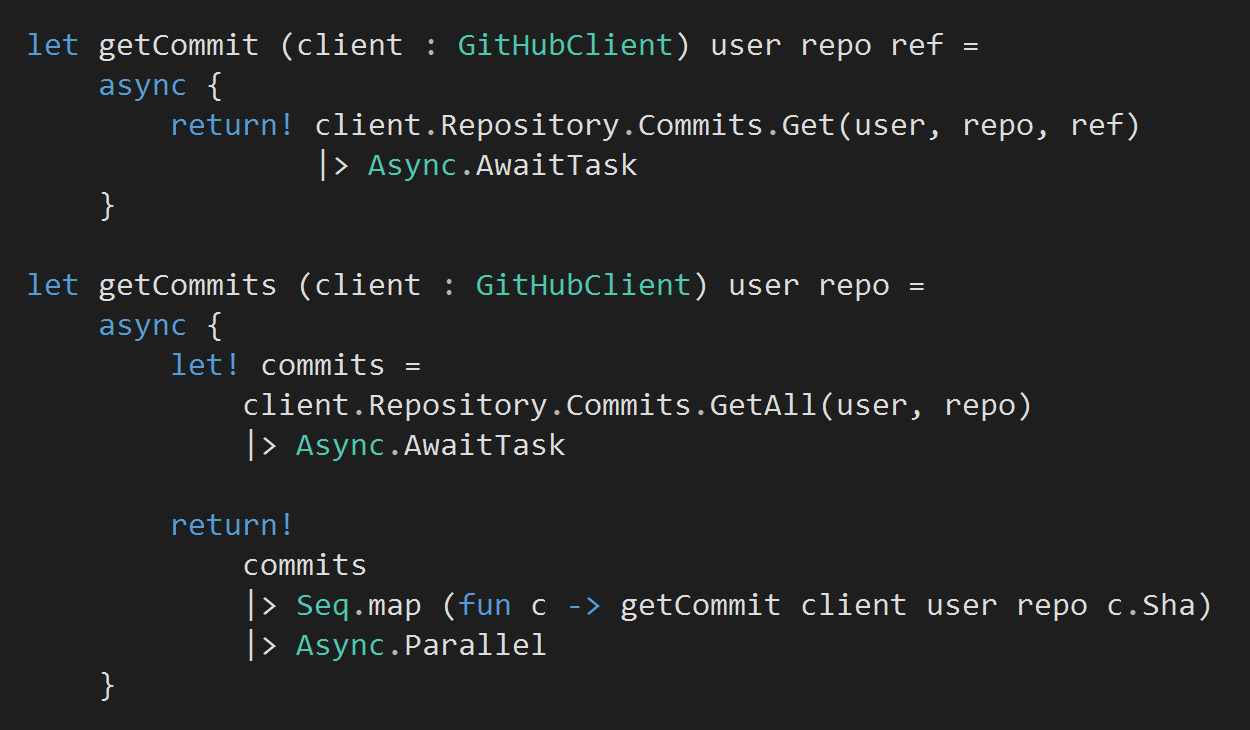
Next, let’s add a couple of functions to download all the commits for a given repo…
A couple of things to note from the above:
- Both functions use F#’s async workflow where any value bound to let! or return! is performed asynchronously. It’s similar to C#’s async-await feature, whose design was heavily influenced by F#’s async workflow, but there are some notable differences and a few gotchas in C#’s async-await).
- client.Repository.Commits.GetAll(..) maps to the ‘List commits in a repository‘ action on the Github API, which doesn’t include some crucial information for our analysis – such as the files changed. Which is why for each commit we also need to call the commit function to fetch all the details for that commit. This is done asynchronously and in parallel.
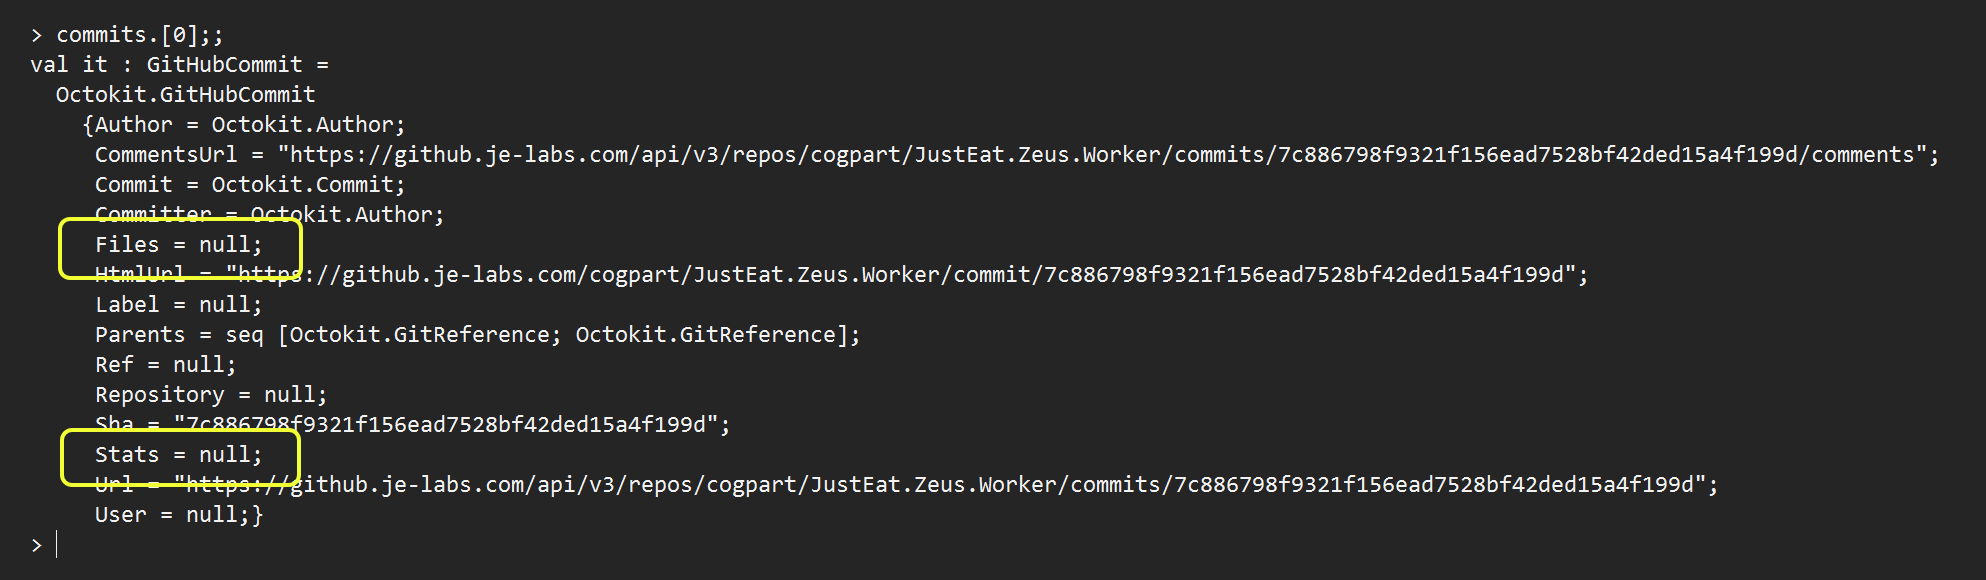
- That client.Repository.Commits.GetAll(…) returns a collection of GitHubCommit instances, but Files and Stats properties are always null by design is an API design flaw – the return type does not accurately describe the contract of the operation and what expectations API consumer should have.
Analysing commits
Now that we have retrieved this high fidelity information about all the commits in a repo, running an analysis becomes a simple matter of writing a function that processes an array of GitHubCommit objects.
For instance, here’s a function that analyses the commits and provides a high level summary of our repo…
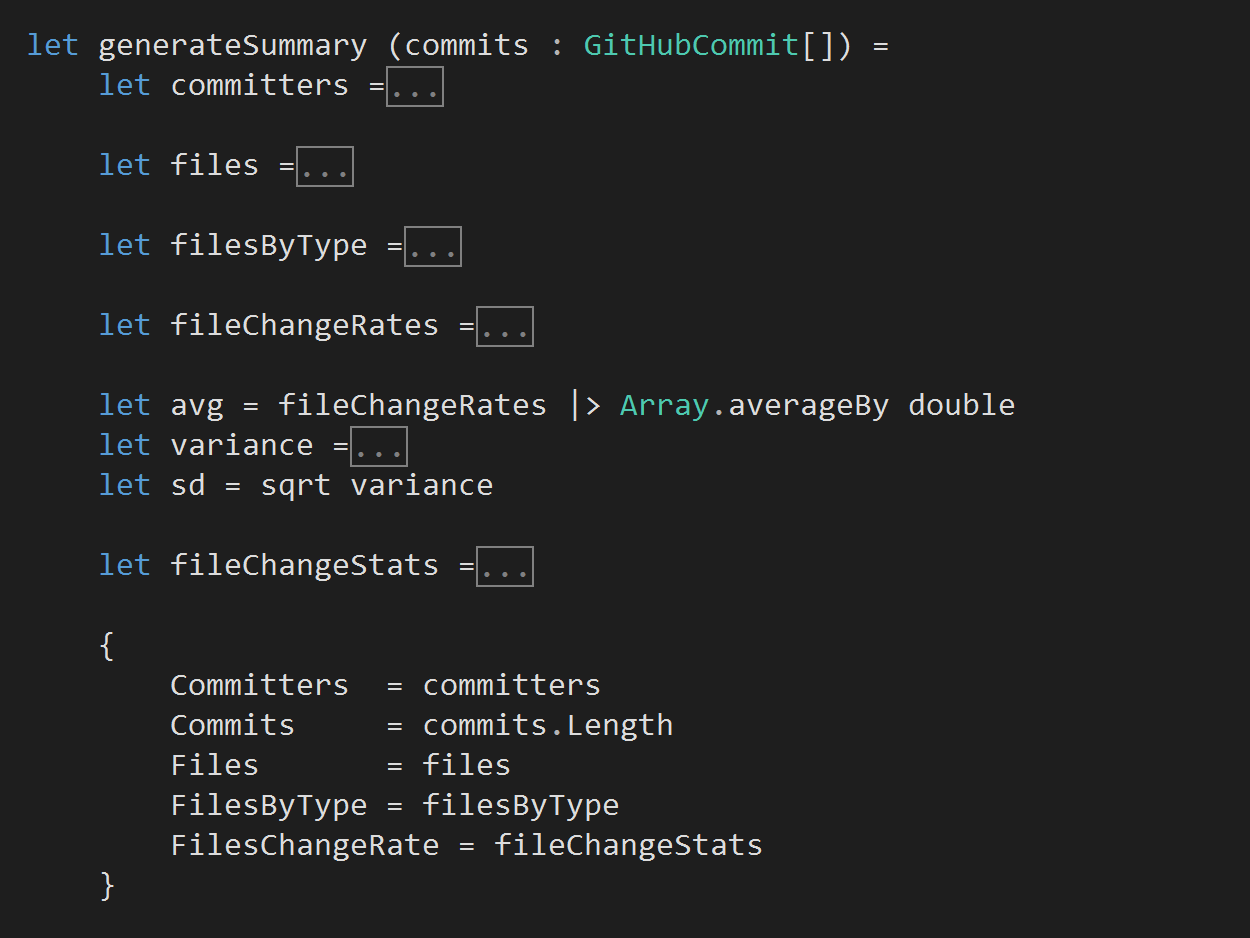
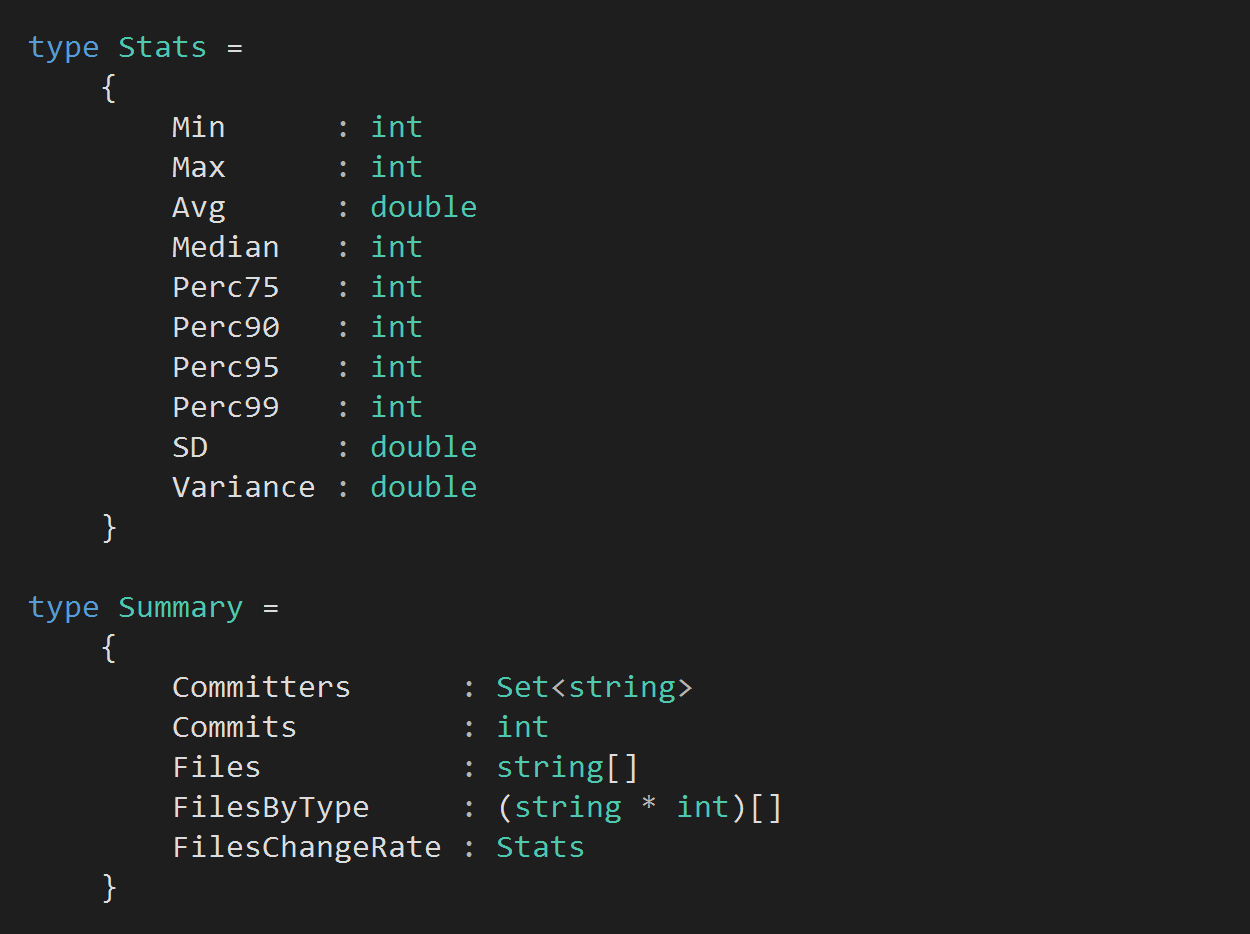
this function returns a Summary type as defined below…
Visualising the results
We can then use XPlot, FSharp.Charting, or even the R Type Provider to quickly plot the results to visualise them.
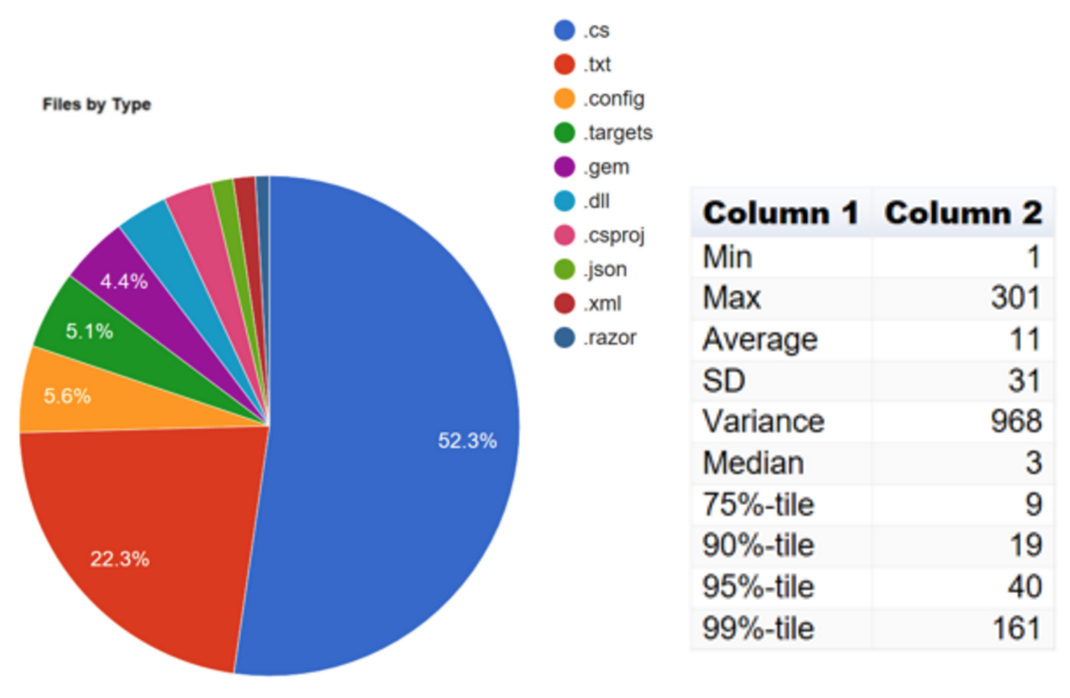
For instance, we can get a break down on the contents of the repo by file type, or see the rate of changes in each commit…
Code noise
Moving beyond the basic analysis we just saw, we can do plenty of interesting things. For example, we were inspired by Simon Cousin’s work and interested to see…
- How much noise (null checks, braces, Etc.) we have in this codebase
- How each kind of noise has changed over time
- How the signal-to-noise ratio (% of useful code) has changed over time
Fortunately, we were again able to borrow heavily from Simon’s work by making use of his open source code.
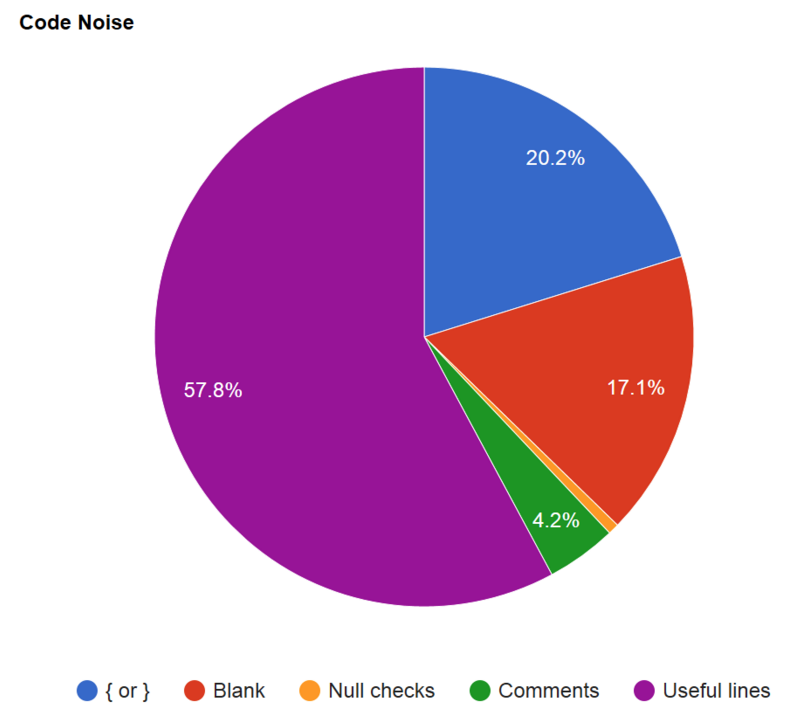
Running the analysis against the head of the repo and visualising the results using XPlot, we can see that the Signal-to-Noise Ratio (SNR) of this repo is 57.8% at the moment.
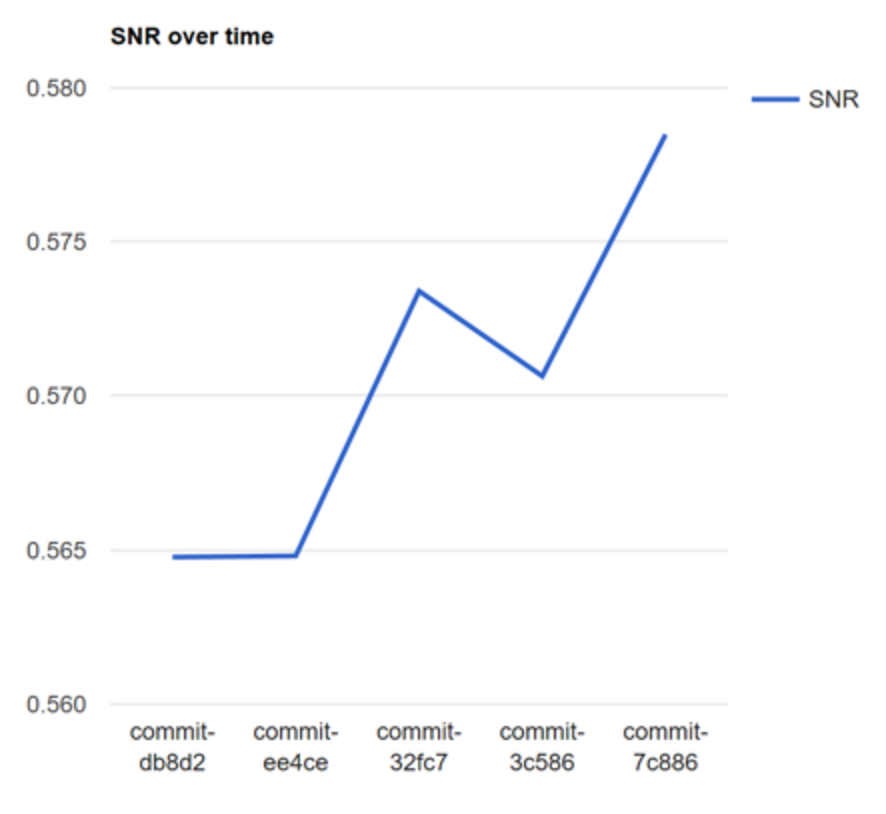
If we sample a few commits over the last 12 months and perform the same analysis, then we can see how they have changed over time (where the oldest commit is on the left).
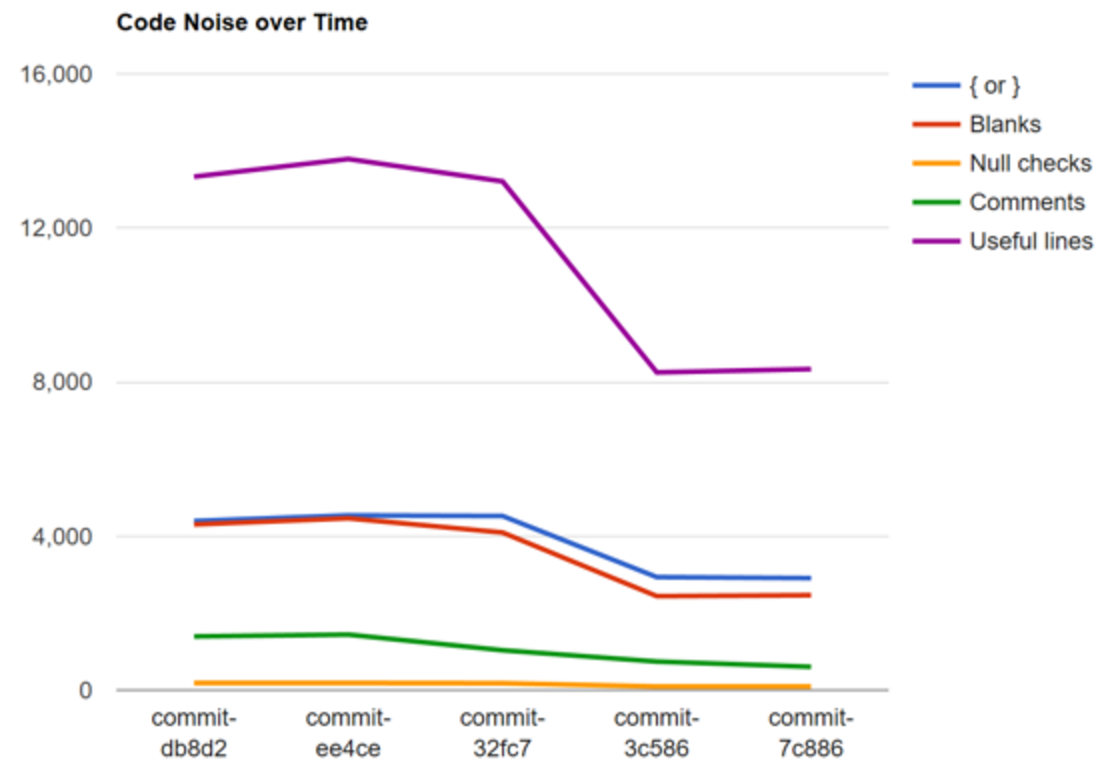
From this graph, we can deduce that some time between commit ref 3cfc7 and ee4ce there was a big refactoring which removed a lot of code.
We can also see from the following graph that, over the last 12 months the SNR has made small but steady improvements.
Temporal coupling
By tracking files that are changed in each commit, we can identify files that are often changed together as a form of temporal coupling.
These temporal couplings could be result of…
- Logical dependency between the files
- Copy-and-pasted code that needs to be updated in sync
- Or maybe something else entirely
We can use the following function to analyse all the commits in a repo and return the top N pair of files that are changed together the most often.
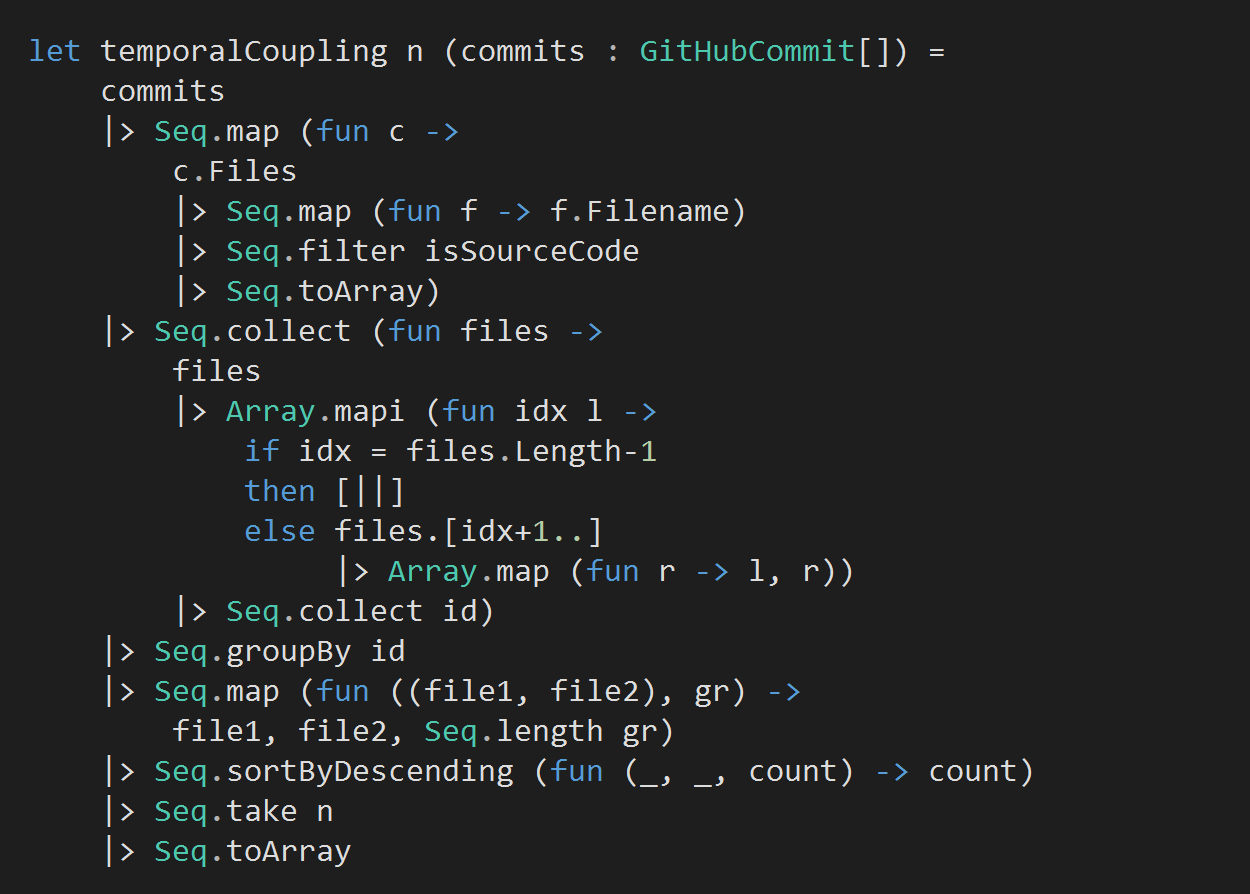
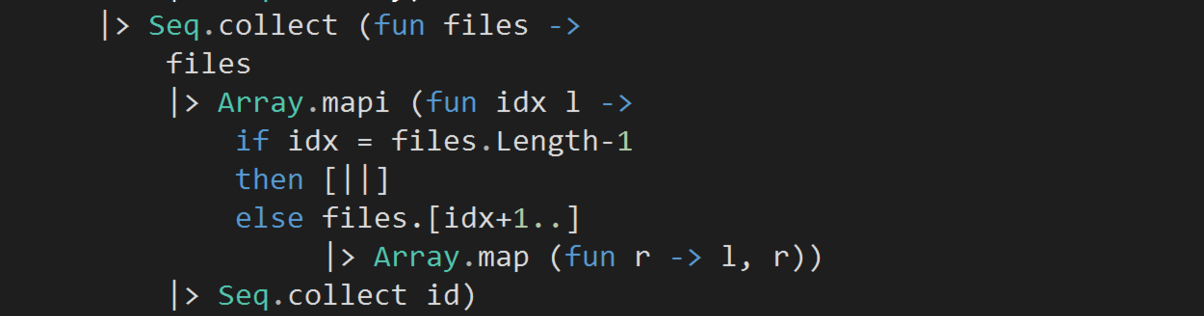
Ok, this is not the most trivial bit of F# code you’ll ever see, so let’s take a moment to explain what’s happening here.
First, there are some things you need to know about F# here.
- We’re using F#’s pipe (|>) operator to chain a sequence of functions calls together, this works the same way as Unix pipes, or pipes in Powershell. The use of pipes is a very common idiom amongst F# programmers and allows you to make nested function calls easier to follow
- The Seq module allows you to create lazy collections, and is analogous to C#’s IEnumerable<T>
- Seq.map is analogous to LINQ’s Enumerable.Select
- Seq.collect is analogous to LINQ’s Enumerable.SelectMany
Given the array of Github commits…
- We first map each commit into an array of source files (ie .cs and .fs files) that were changed in that commit
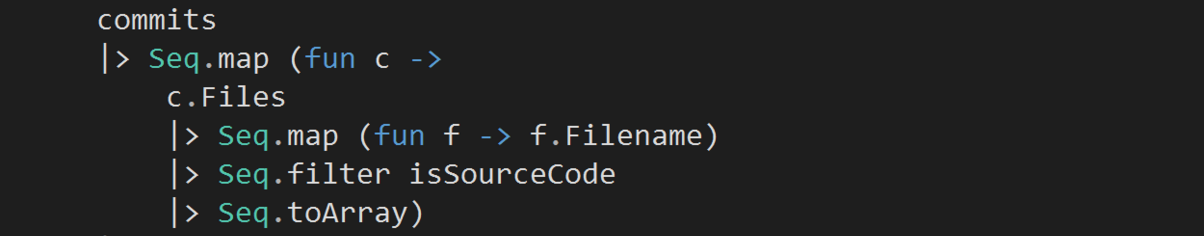
- Then for each array, we turn the files into pairs by mapping each file into an array of string-string tuples with other changed files. Eg for the array [| “A”; “B”; “C”; “D” |], we’ll generate the following arrays (one for each element):
- [| (“A”, “B”); (“A”, “C”); (“A”, “D”) |]
- [| (“B”, “C”); (“B”, “D”) |]
- [| (“C”, “D”) |]
- [| |]
- We’ll collect all the elements from these subarrays into one sequence of string-string tuples using Seq.collect (which takes a mapping function, so in this case we supplied it with the identity function, id)
![]()
- By now, we have transformed the files for each commit into pairs of files that were changed together in that commit. Let’s collect all such pairs from all the commits into one unified sequence, which is what the outer Seq.collect does.
- Since some files are changed together often, we expect some of these tuples to be duplicated and the number of duplicates will tell us how often those files have changed together. To do that, let’s group the tuples by themselves.
![]()
(But wait, ‘what if “A” appears before “B” in some commits but not others? Would you not miss some duplicates because of ordering of the pair?’ Great question, fortunately the GitHubCommit.Files list is already sorted, so “A” will always appear before “B” in this case).
- Now we can further massage the grouped data into the shape we want. Sort by count, and return only the top N results as an array.
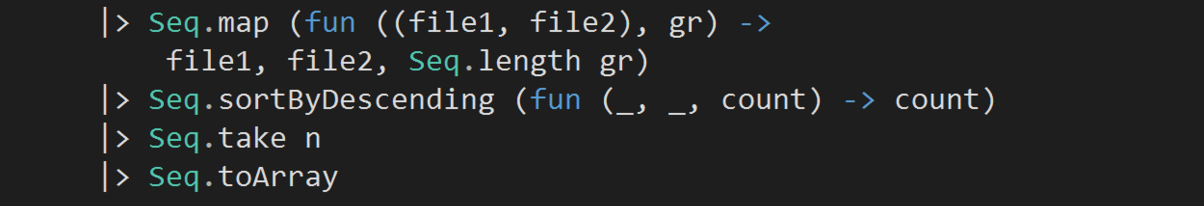
(notice in this last code snippet, we’re using pattern matching to extract the elements of the string-string tuple out as file1 and file2. In C#, you’d have to write something along the lines of…
__.Select((tuple, gr) => Tuple.Create(tuple.Item1, tuple.Item2, gr.Length()));
I think it’s fair to say the F# version with pattern matching is much more expressive)
We can then take the results of this function and visualize them in a Sankey diagram.
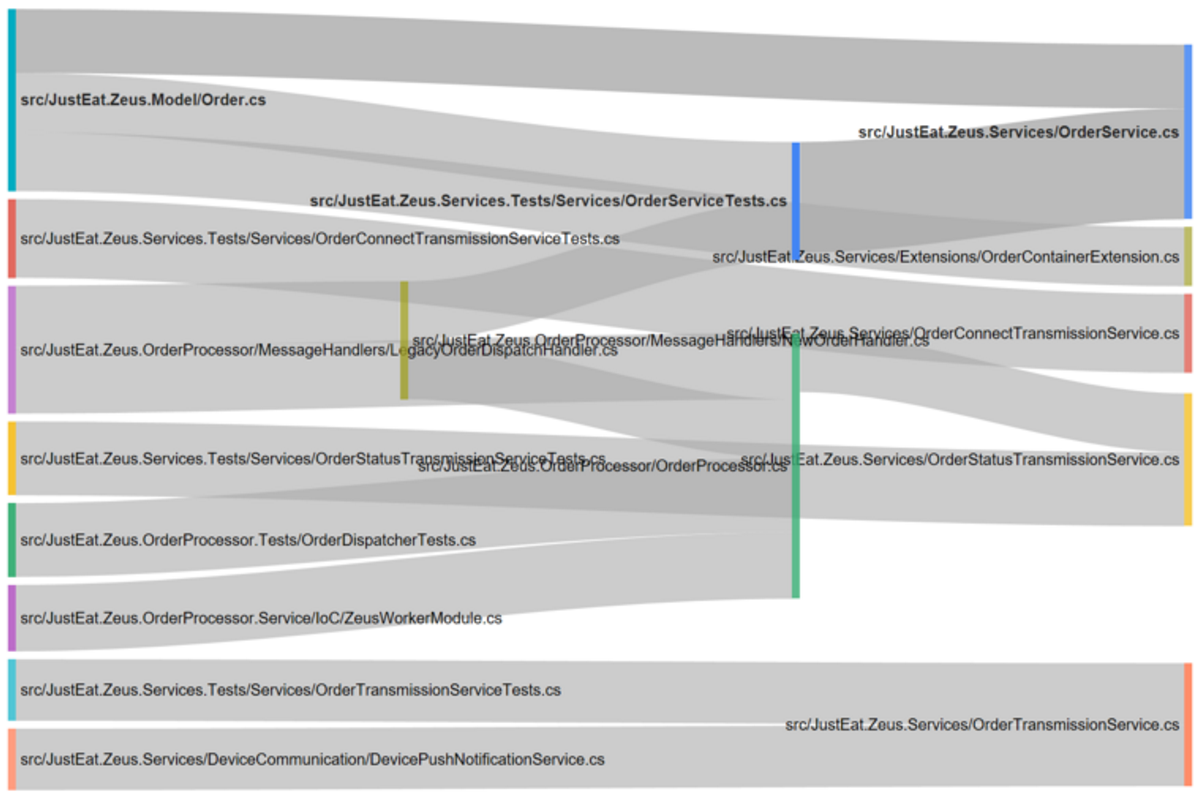
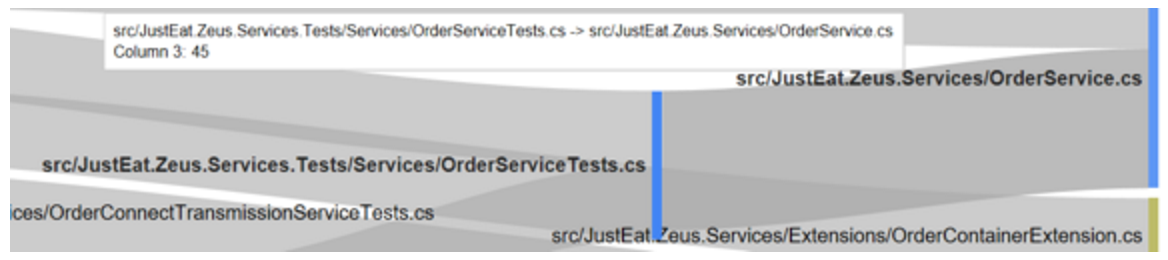
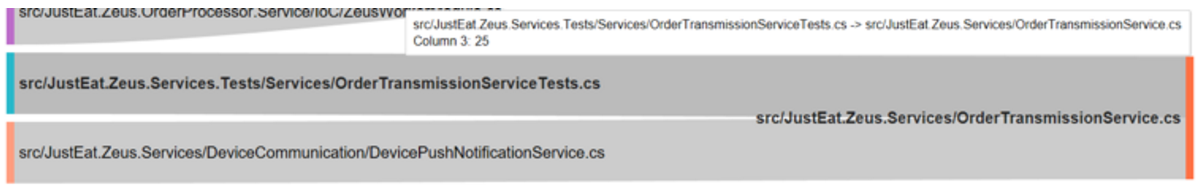
Some interesting things popped out, for instance, OrderService.cs and OrderServiceTests.cs are changed together an awful lot:
So perhaps that’s an indication that the tests are too tightly coupled to the implementation?
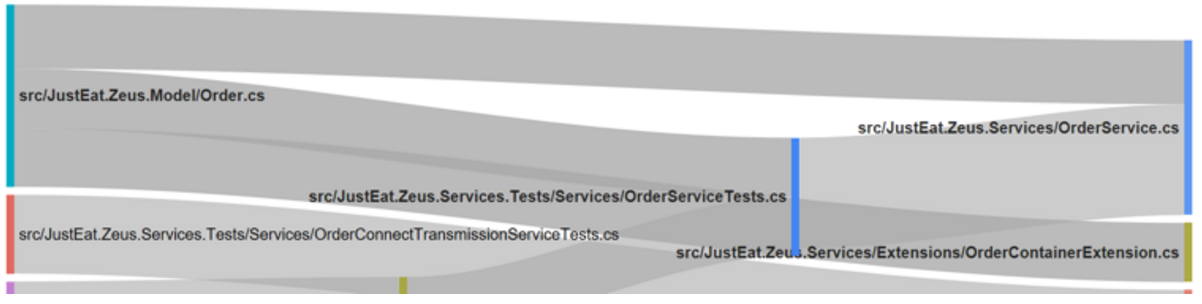
The same theme is repeated a few times throughout this data set, eg with OrderTransmissionService.cs and OrderTransmissionServiceTests.cs
When Order.cs is changed, it tends to be changed along with OrderService.cs, OrderServiceTests.cs and OrderContainerExtension.cs. This sounds like a case of logical dependency – OrderService processes Order, and OrderServiceTests uses Order to test OrderService, etc.
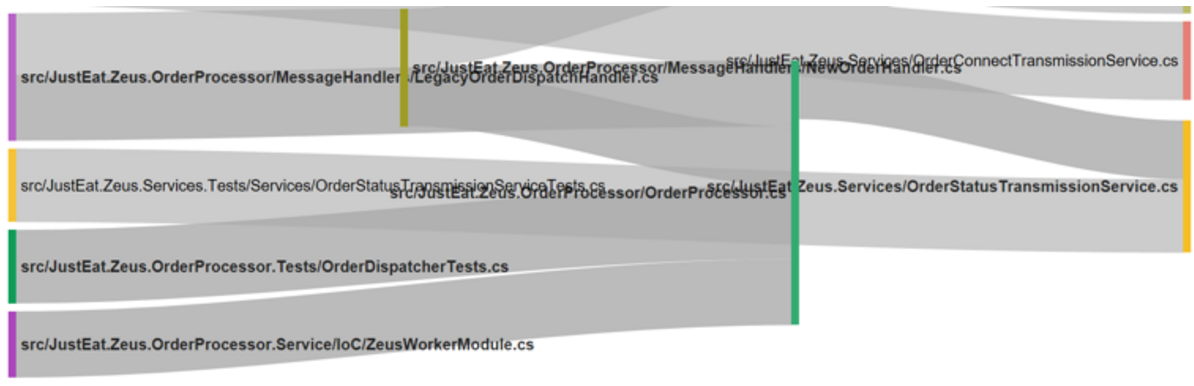
Finally, we can also see that OrderProcessor.cs (the green bar in the middle) is an important component in this repo since it depends on/is depended upon by many other components.
So if you’re new to this repo and want to quickly figure out how the various parts fit together, OrderProcessor.cs might be a good starting point.
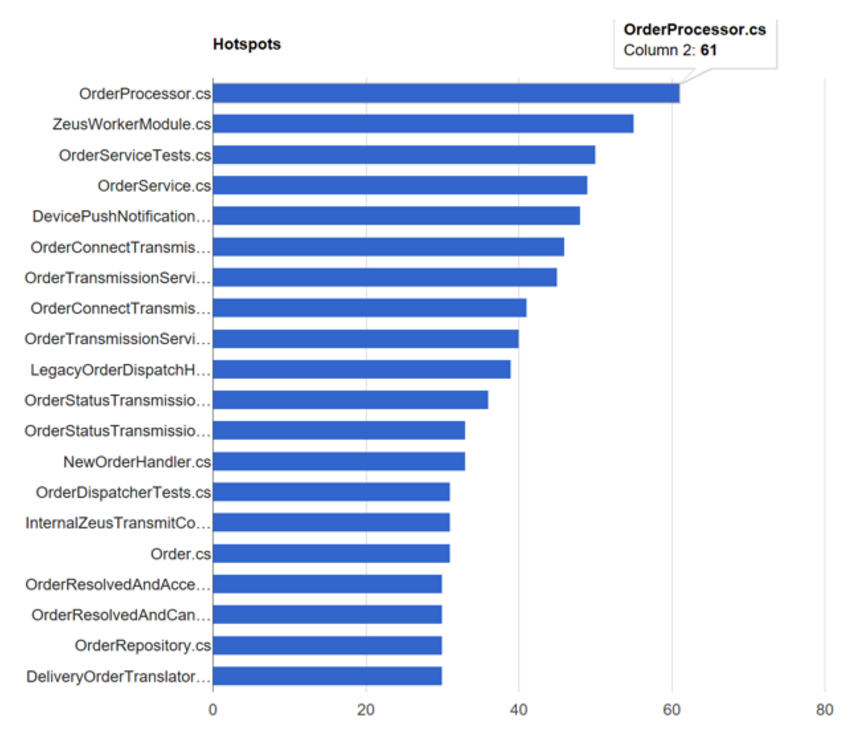
Hotspots
We can find hotspots in the repo by ranking files by how often it is changed.
We can also find hotspots by committer count, ie the number of programmers that has changed that file.
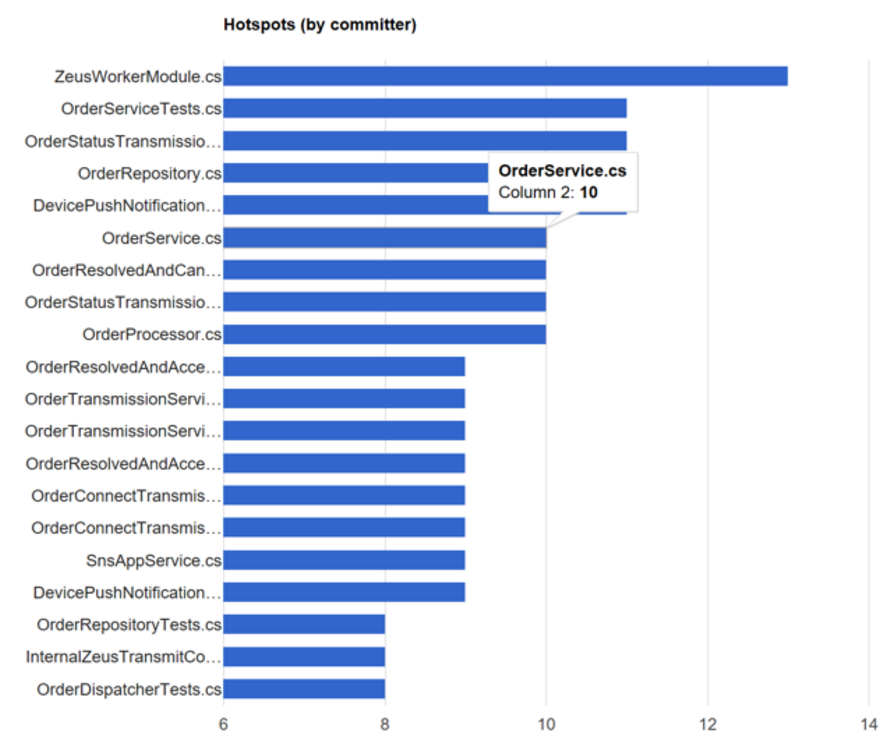
This is useful to know because:
- The number of programmers that works on a file is an effective indicator of the likelihood of defects
- Many committers on the same file is an indication that file (or corresponding class) has too many responsibilities and therefore reason for many programmers to change it
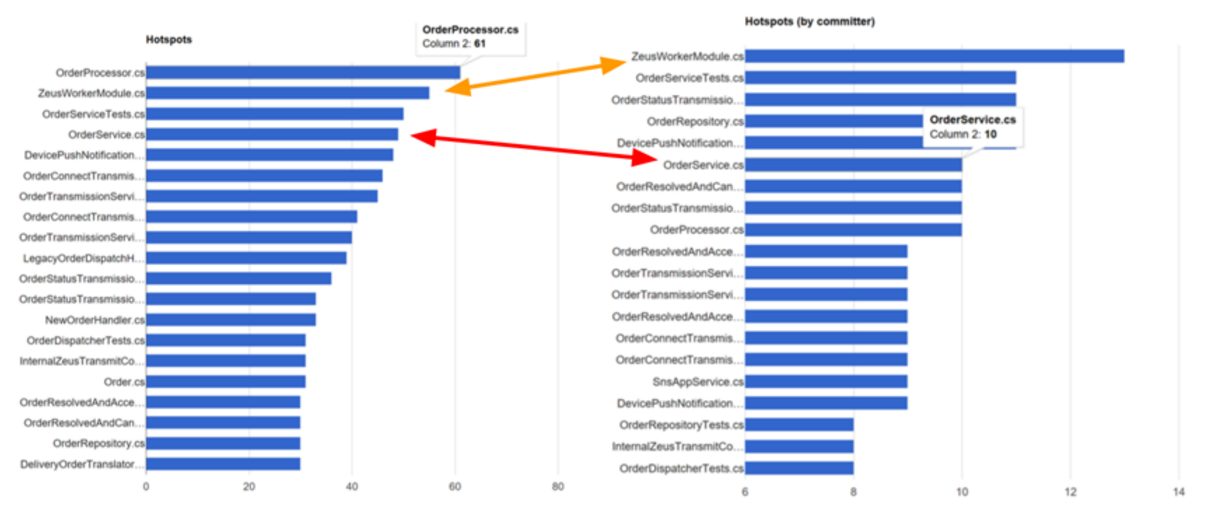
If you compare the two graphs side by side, then you can easily identify files that are changed often, and by many programmers. These are good candidates for refactoring.
Commit patterns
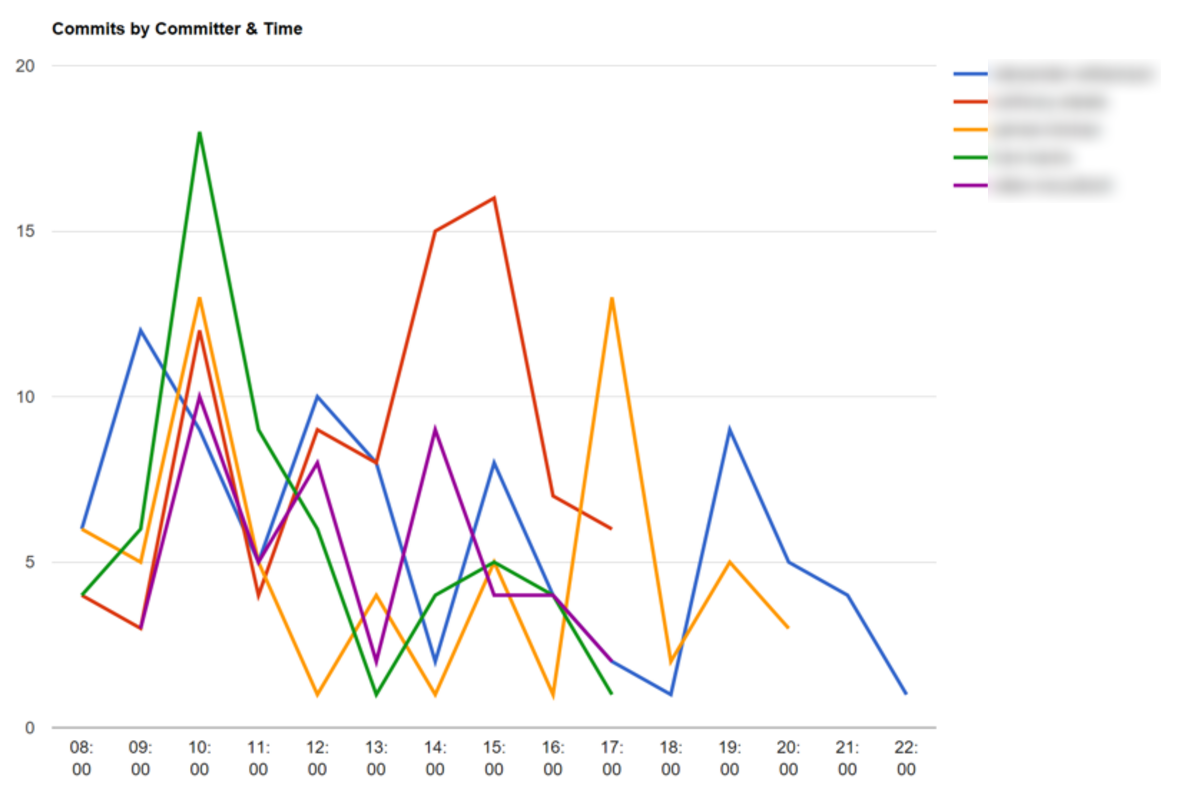
By analysing the timestamp of the commits, some patterns about the way people work start to surface.
For instance, some developers like to commit at the start and end of the day.
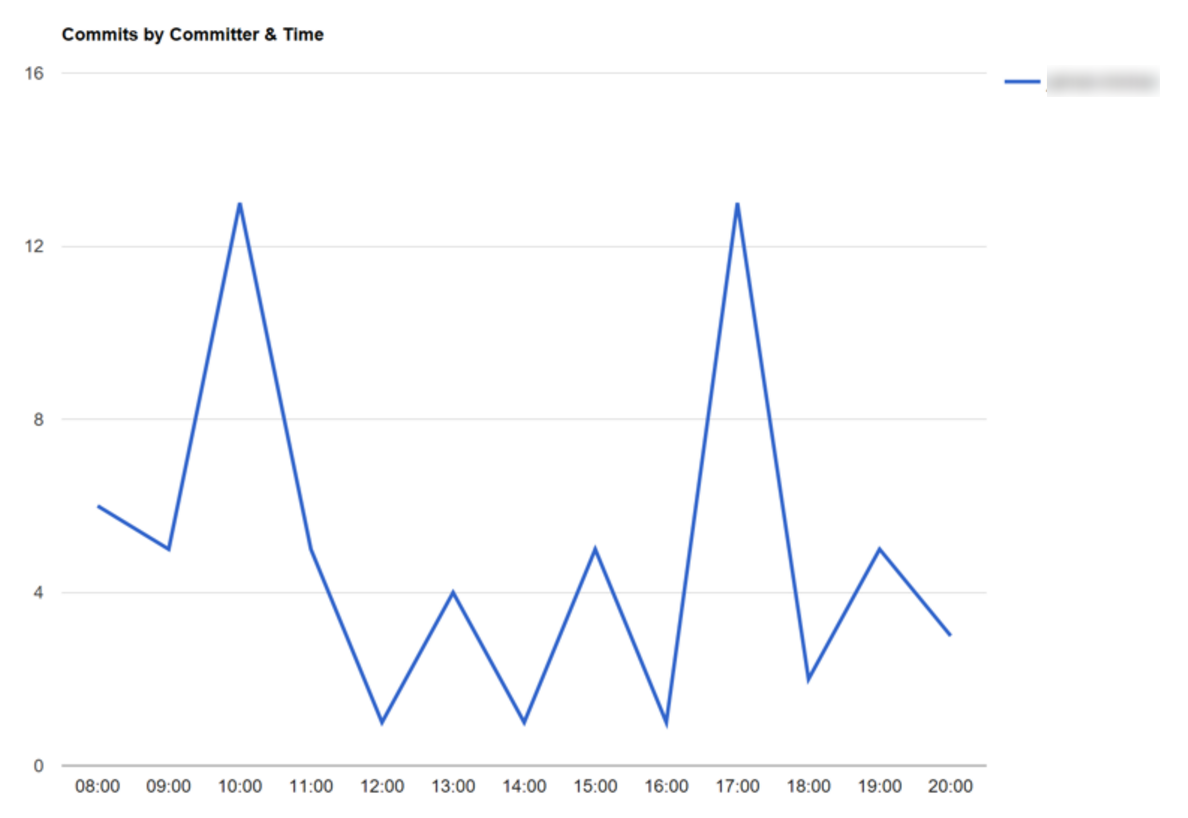
In general, the programmers working on this repo tend to commit more often in the morning. So perhaps we could introduce a quiet-hour policy (i.e. no meetings) between 9 and 11am so that they can better focus during the most productive part of their day?
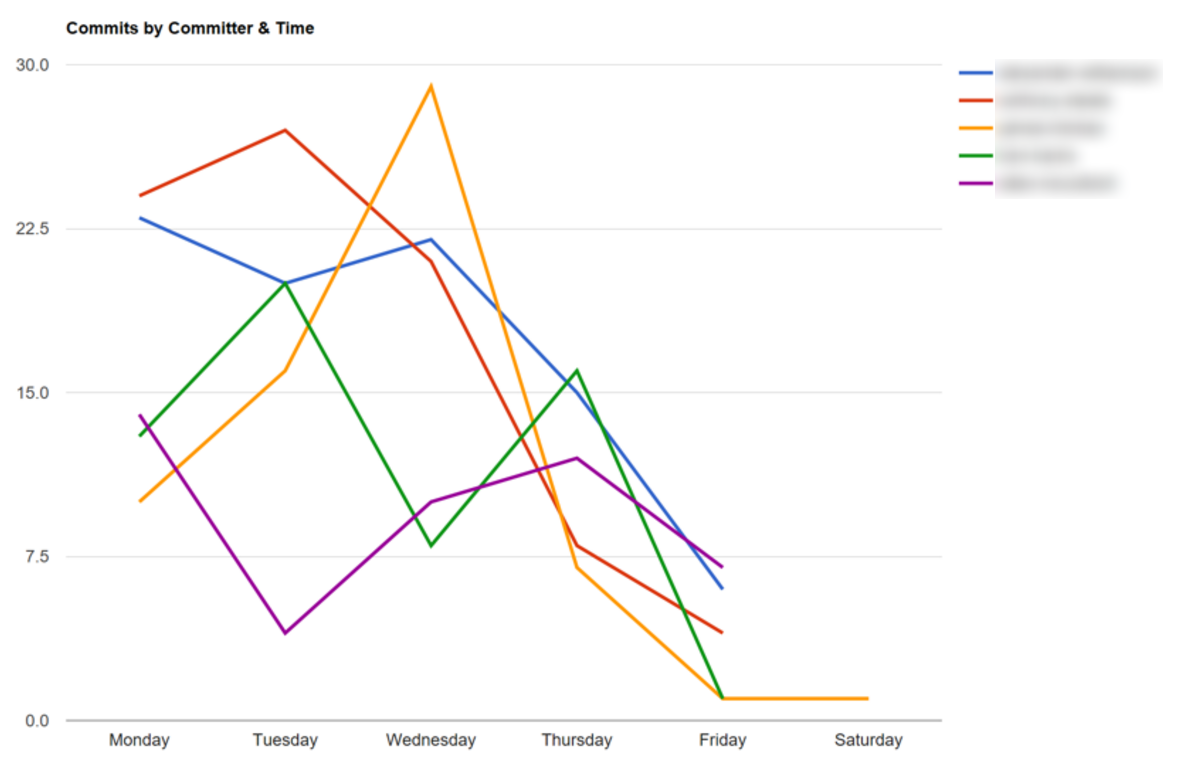
We can also see how often programmers commit by the day of the week. For instance, we might find that programmers commit more often from Monday to Wednesday because it’s safer to deploy changes.
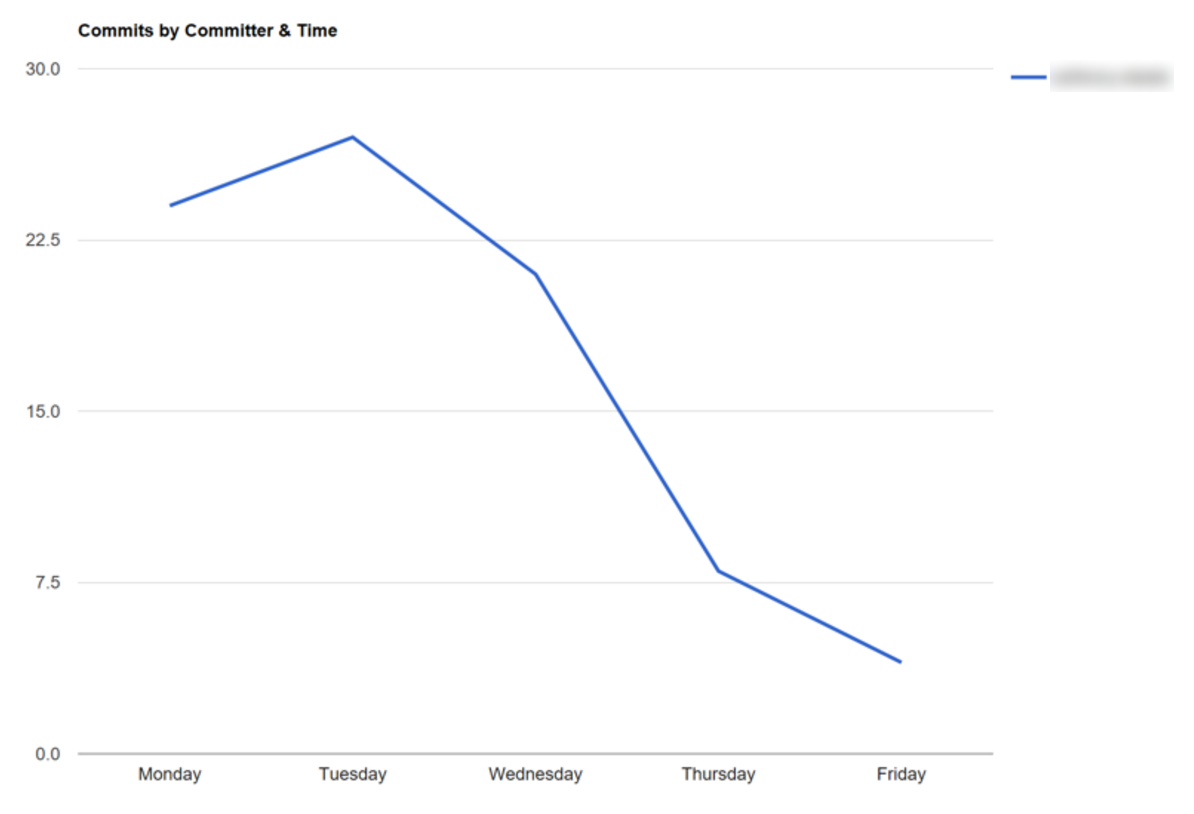
Unsurprisingly we found the same drop-off in commit frequency across all the top committers in this repo. Clearly nobody wants to deploy a buggy build on a Friday afternoon and then deal with the fallouts over the weekend.
Once we have identified these patterns, we can investigate further and ask people if that’s how they prefer to work. If not, what can we do as an organisation to help shape their work pattern to better fit the way they ideally like to work?
So despite not appearing very useful (though slightly amusing) at first, understanding your programmers’ commit patterns can help you ask interesting questions about your organisation and act as a catalyst for change.
Knowledge owners
Your analysis doesn’t have to be limited to just one repo.
For example, you can find your top repos by commit count.
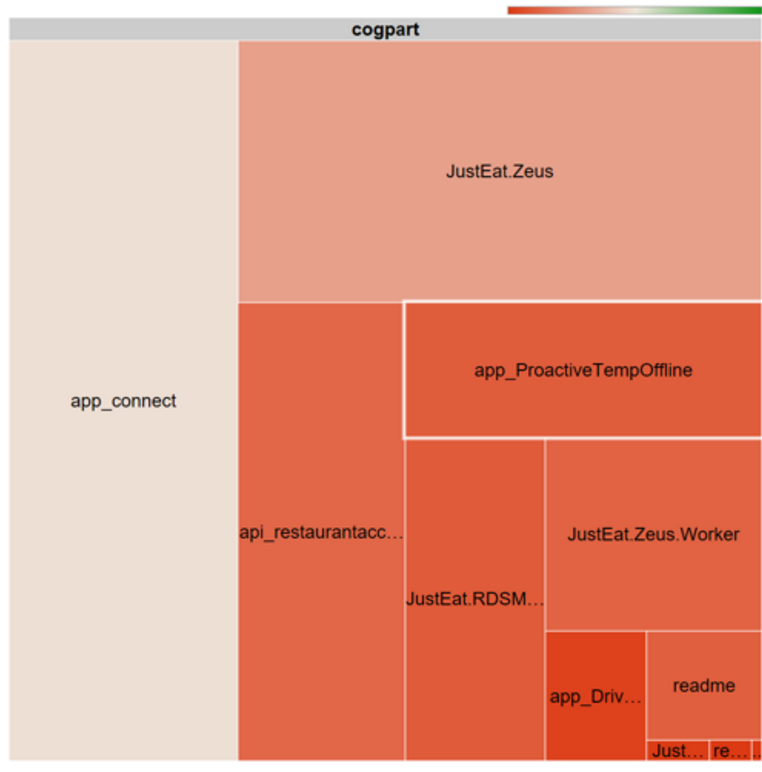
And for each of the repos, click through to see who are the top committers.
These top committers – especially those in green – are the ‘knowledge owners‘ of these components as they have the most knowledge about them. As you repeat the exercise across all of your repos, you can identify the key players in your organisation – people who are knowledge owners of many components.
These key players are very important to your organisation, so treat them accordingly. At the same time, they also represent risk of potential knowledge loss if they were to leave, especially if they are singlehandedly responsible for most of the commits in many repos.
So having identified the risk, you can be more proactive about knowledge sharing and start spreading knowledge and responsibility around the team more evenly.
Single point of failures (SPOFs) are such an important topic in software architecture, and where you have software that is designed and written by people you also have dependency on people.
Institutional SPOFs are just as damaging and its effects can be even longer lasting. Loss of knowledge is often cited as the reason to rewrite or abandon entire subsystems, and yet many might have been prevented had we identified the risks earlier. Hopefully, with the ability to easily identify institutional SPOFs we can mitigate them before more drastic actions are required after the fact.
Integrate with other systems
You’re not limited to Github commit history either. Within your organisation, you can also integrate with your CI solution, bug tracking system, or logging/monitoring systems too.
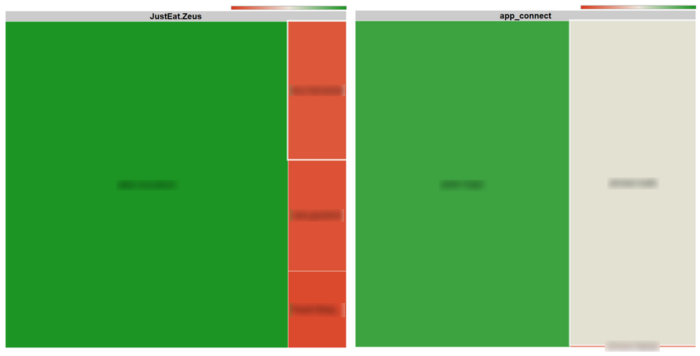
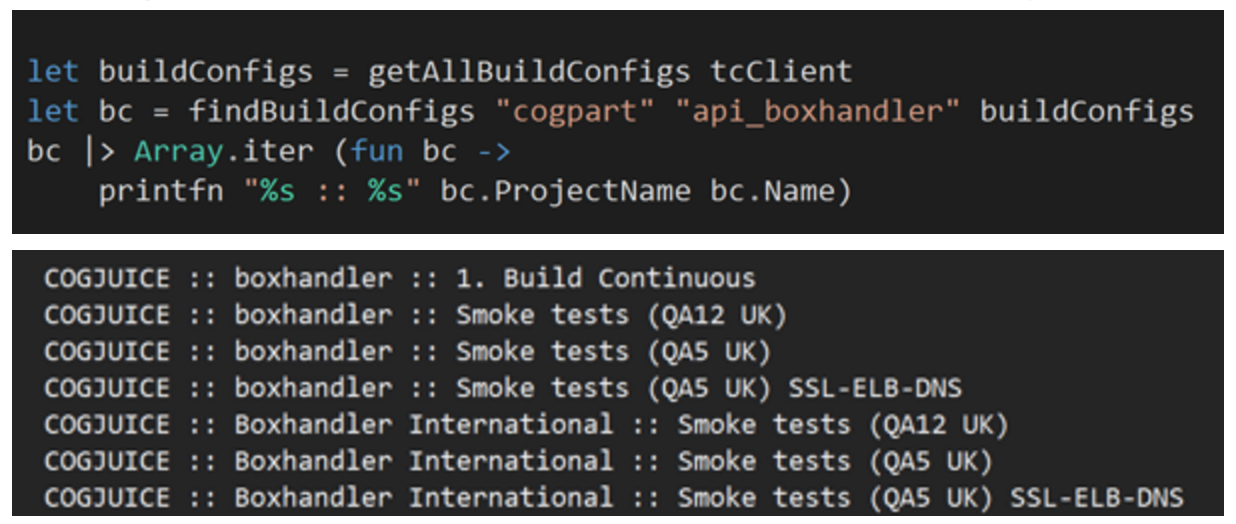
For example, we use TeamCity for most of our automation tasks at JUST EAT. With thousands of build configurations, it can be overwhelming and sometimes hard to even find the right build configuration for the project you’re working on.
So, what if you can integrate your analysis tool with TeamCity, and for each repo, report the build configurations that are connected to it? Wouldn’t that make life easier for you?
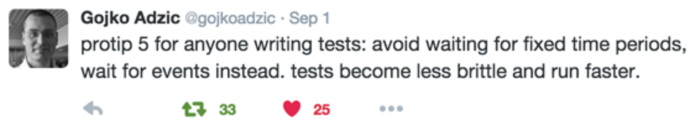
Find brittle tests
You can also detect builds that fail from time to time due to flakey tests – perhaps your tests have dependency on time and the performance characteristics of the build server is different from your local machine and throwing your timing off?
Find buggy code
You can also integrate with bug tracking systems such as JIRA and find code that are most buggy. If you correlate that with results from other analysis (eg hotspot, LOC, cyclomatic complexity, etc.) then you might find out other interesting things about your codebase.
Or, maybe you can correlate error logs from your logging system in production (eg Elasticsearch is a popular choice and used heavily here at JUST EAT) back to particular commits/releases?
Other ideas
Besides the more serious ideas that we have mentioned, you can also do quirky things, for example…
‘Angry Coder’ – perform sentiment analysis on commit messages and find your most angry programmer. (Evelina Gabasova has a nice example on how to do sentiment analysis using the Stanford NLP Parser library)
‘Bad code terminator’ – aggregate deletion stats by committer and see who deletes the most code over the history of this repo, or even across all your repos.
‘Hear/See your commits’ – generate random music/image from the stats/changes of your commits.
The possibility is really endless, and I’m interested to hear what use cases you have in mind too (both serious and fun ones), so be sure to comment and let us know what you come up with!
I know it’s been a while, but is the code from the hackathon publicly available anywhere?
Comments are closed.